
|
The SUSI 1x1 CCD 46 (A-right) Page | 
|
|
|
The SUSI 1x1 CCD 46 (A-right) Page |
|
 Derivatives
Standard CCD Test Long CCD Test
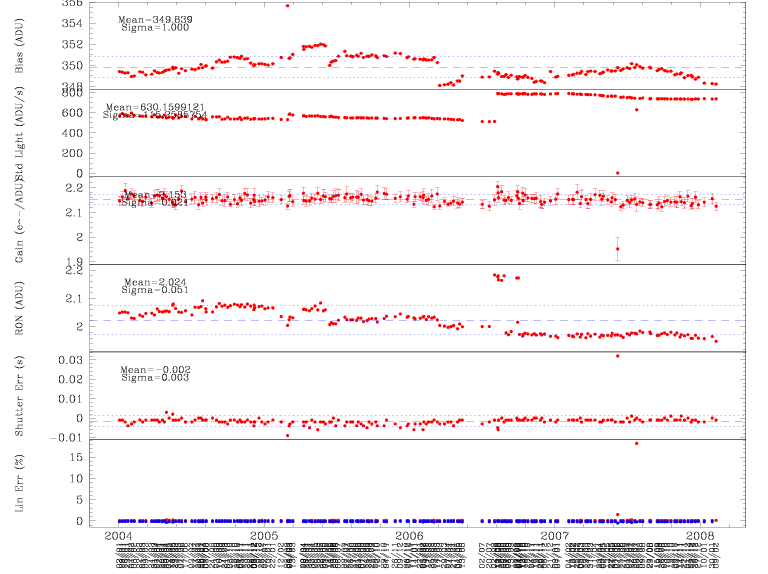
For printing, the above plot is also available in postscript format . The raw data can also be viewed in a tabular format.
*** MIDAS logfile (05SEPpl1.2) *** Sa, 01 Mar 2008   15:16:30   Page 1


*** MIDAS logfile (vers. 05SEPpl1.2) *** Sa, 01 Mar 2008   15:16:44   Page 2

     ==========================================================
     SUMMARY STANDARD TEST CCD#46 TAKEN ON 080301 IN normcd MODE
     ==========================================================

      BIAS
      ====

      5 biases at start test: average = 348.45 stddev =   1.96
               FIERA temperature = 273.15 K
      There were 0 hot pixels/columns detected


      TRANSFER FUNCTION AND LINEARITY DATA
      ====================================

  Table : Std_normcd_46_080301
 Sequence Exp_tim1  Med_cnt1  Med_cnt2  Variance  Frc_cnt1  Frc_cnt2  el_adu1
 -------- --------- --------- --------- --------- --------- --------- ---------
        1      2.17    1589.4    1589.6     787.0      0.11      0.12      2.02
        2      4.34    3167.3    3168.2    1578.2     -0.19     -0.17      2.01
        3      8.67    6339.4    6338.7    3145.7     -0.08     -0.09      2.02
        4     13.00    9506.9    9506.2    4728.9     -0.10     -0.10      2.01
        5     19.51   14265.7   14265.5    7074.1     -0.06     -0.06      2.02
        6     26.01   19028.3   19028.6    9307.2     -0.01     -0.01      2.04
        7     32.51   23794.0   23794.7   11653.4      0.03      0.03      2.04
        8     43.34   31748.2   31746.7   15241.1      0.10      0.09      2.08
        9     54.17   39682.6   39683.6   18900.0      0.10      0.10      2.10
       10     65.01   47620.6   47620.6   22398.4      0.10      0.10      2.13
 -------- --------- --------- --------- --------- --------- --------- ---------

      Dynamic range explored: from 3376 to 101135 e-
      Average count rate measured: 732 ADU/sec.

      CONV. FACTOR AND RON
      ====================

      C.Fact =   2.12 +/-   0.02 e-/ADU

      RON    =   4.17 +/-   0.03 e- RMS


      SHUTTER ERROR
      =============

 Average shutter error derived from fractional count rate = -0.001 sec


      LINEARITY ERROR
      ===============

 Average linearity error after shutter correct. = + 0.11/-0.18 %

 These errors represent maximum deviation in % from the average
 count rate after correction for shutter delay
In addition, the previous standard tests are available. Click in the table below to access these files.
In the above table, the postscript files are:
| Column Number | Description |
|---|---|
| 1 | Average of the rows and cols. of the bias image |
| 2 | Combined bias frame of 5 bias images |
| 3 | Histogram of the bias image |
| 4 | Plots of exposure sequence, unedited transfer and raw linearity |
| 5 | Plots of filtered linearity and differential non-linearity in |
| 6 | Filtered transfer curves for both data sets |
Note: filtered means that saturated images or deviating too much from the other data, if present, have been removed.
Below are the results of the long tests carried out by ODT. Be warned that these are large compressed tar files, and are of specialised interest. To download, press the shift key and click on the hypertext link with your middle mouse button.
| Long Tests |
|---|
|
ntt Team CCD Page |
ntt Team Home Page | Last update: 01/03/08 Comments to nttccd@eso.org |
|---|